Average member saves $4,180 per year

See what your malpractice premium should cost.

Most physicians overpay because they only see one carrier’s number. Compare premiums from six A-rated MPL carriers in under a minute — including 10-year claims-made projections — with no phone call required.

23%
Avg. premium reduction
6
A-rated carriers
<90s
From start to quote

Get an MPL pricing indication

Indicative premiums from top-rated MPL carriers in under a minute.

1
2
3
4
5
6

What is your specialty?

Select the classification that best matches your practice.

Sharing your 10-digit NPI lets your broker pre-fill credentialing details so the quote-to-bind path is faster.

No login required. We never share your information without consent.

Real savings, real physicians

When physicians compare, they save.

A snapshot of what we’re seeing across recent quotes. Specialty, state, and limits drive most of the variance.

Internal Medicine
Chicago, IL · 32 hrs/wk
Annual savings
$4,220
−30%
“I'd been with the same carrier for nine years. Comparing took two minutes and saved me $4,220 on the renewal.”
Was paying
$14,200
Now paying
$9,980
Orthopedic Surgery
Tampa, FL · 45 hrs/wk
Annual savings
$9,700
−20%
“Surgical specialties get hit hardest. Seeing the carrier-by-carrier breakdown changed how I negotiate my renewal.”
Was paying
$48,600
Now paying
$38,900
Pediatrics
Austin, TX · 36 hrs/wk
Annual savings
$1,820
−25%
“I'm in a small practice. The crossover projection showed me which carrier is cheaper at year five, not just year one.”
Was paying
$7,400
Now paying
$5,580
Emergency Medicine
Denver, CO · 40 hrs/wk
Annual savings
$5,160
−23%
“Found a carrier my broker hadn't even pitched. The savings paid for two months of office rent.”
Was paying
$22,800
Now paying
$17,640
OB/GYN
Atlanta, GA · 48 hrs/wk
Annual savings
$8,200
−22%
“I assumed OB premiums were just OB premiums. Three carriers came in within 8% of each other &mdash; one was 22% lower.”
Was paying
$36,500
Now paying
$28,300
Family Medicine
Seattle, WA · 30 hrs/wk
Annual savings
$2,580
−26%
“Painless. I had my comparison emailed to me before my coffee got cold.”
Was paying
$9,900
Now paying
$7,320

Composite figures shown for demonstration. Your savings depend on specialty, location, limits, claims history, and carrier appetite. Premiums are indicative until bound.
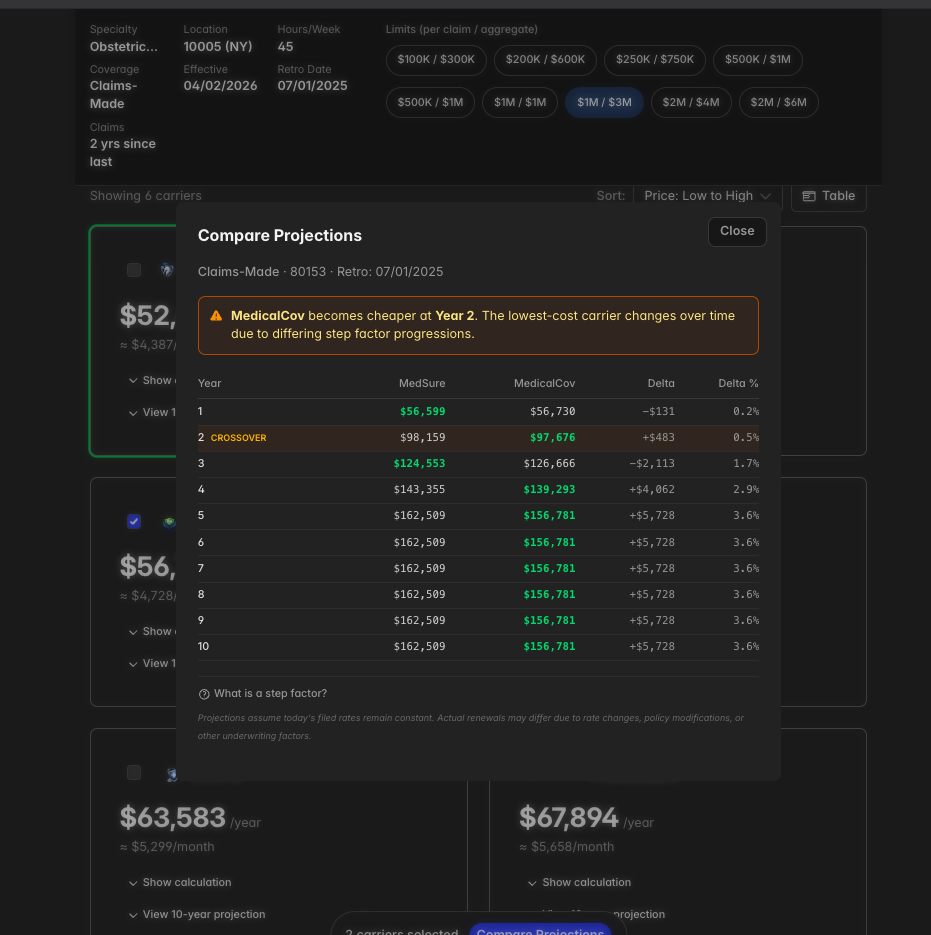
Claims-made matters

See where the cheapest carrier flips.

Claims-made premiums step up over five years as your policy matures. A carrier that’s cheapest in year one often isn’t cheapest in year four. Our projection tool overlays carriers side by side and highlights the crossover year so you can pick the carrier you’ll still be glad you picked five renewals from now.

  • Full 10-year premium curve per carrier
  • Auto-detected crossover year
  • Step factor and discount detail per year
Compare Projections showing crossover year where MedicalCov becomes cheaper than MedSure at Year 2

Three steps. No phone tag.

From specialty to side-by-side carrier comparison in under a minute.

1

Tell us about your practice

Specialty, ZIP, weekly hours, claims history. We support 60+ class codes across all 51 states.

2

Pick coverage and limits

Claims-made or occurrence, $100K/$300K through $2M/$6M. Adjust on the fly and watch premiums update.

3

See your savings

Carriers ranked by premium with full factor breakdown and a 10-year projection. Emailed to you for safe-keeping.

What could you save?

The physicians above didn’t switch carriers because they were unhappy — they switched because they finally saw the comparison. Run yours in under 90 seconds.

Start my quote